Guide Rails Overview
Guide Rails allow teams to set measurable goals for any metric in GuideMode and track progress over time. Whether you want to reduce cycle time, improve PR merge rates, or increase deployment frequency, guide rails help you define success and monitor your team’s performance against those goals.
Why Use Guide Rails?
Section titled “Why Use Guide Rails?”| Benefit | Description |
|---|---|
| Clear Goals | Define specific, measurable objectives for your team |
| Real-time Tracking | See at a glance whether you’re on track, at risk, or off track |
| Historical Context | Set guide rails based on your actual historical performance data |
| AI Assistance | Let Giulia recommend guide rails based on your natural language goals |
| Team Alignment | Share guide rails across teams and copy successful configurations |
Core Concepts
Section titled “Core Concepts”Guide Rail Types
Section titled “Guide Rail Types”GuideMode supports four guide rail types to match different KPI patterns:
| Type | Direction | Example | When to Use |
|---|---|---|---|
| Minimum | Higher is better | Code quality score >= 85 | Metrics you want to maximize |
| Maximum | Lower is better | Cycle time <= 5 days | Metrics you want to minimize |
| Exact | Close to value | SLA compliance = 95% | Metrics with a specific goal |
| Range | Between bounds | PR size 50-200 lines | Metrics with acceptable bounds |
Granularity
Section titled “Granularity”Choose how often guide rails are measured:
| Granularity | Use Case | History Shown |
|---|---|---|
| Daily | High-frequency metrics needing close monitoring | ~30 days |
| Weekly | Most team metrics (recommended default) | ~12 weeks |
| Monthly | Slower-changing strategic metrics | ~12 months |
| Quarterly | Long-term objectives and OKRs | ~8 quarters |
Available Metrics
Section titled “Available Metrics”Guide rails can be set on any measure from GuideMode’s analytics cubes:
- Discovery Flow - Research validation times, conversion rates
- Delivery Flow - Cycle time, lead time, PR merge rates, throughput
- Deployment Flow - DORA metrics, deployment frequency, change failure rate
- AI Productivity - Code generation rates, AI tool adoption metrics
Finding Guide Rails in the UI
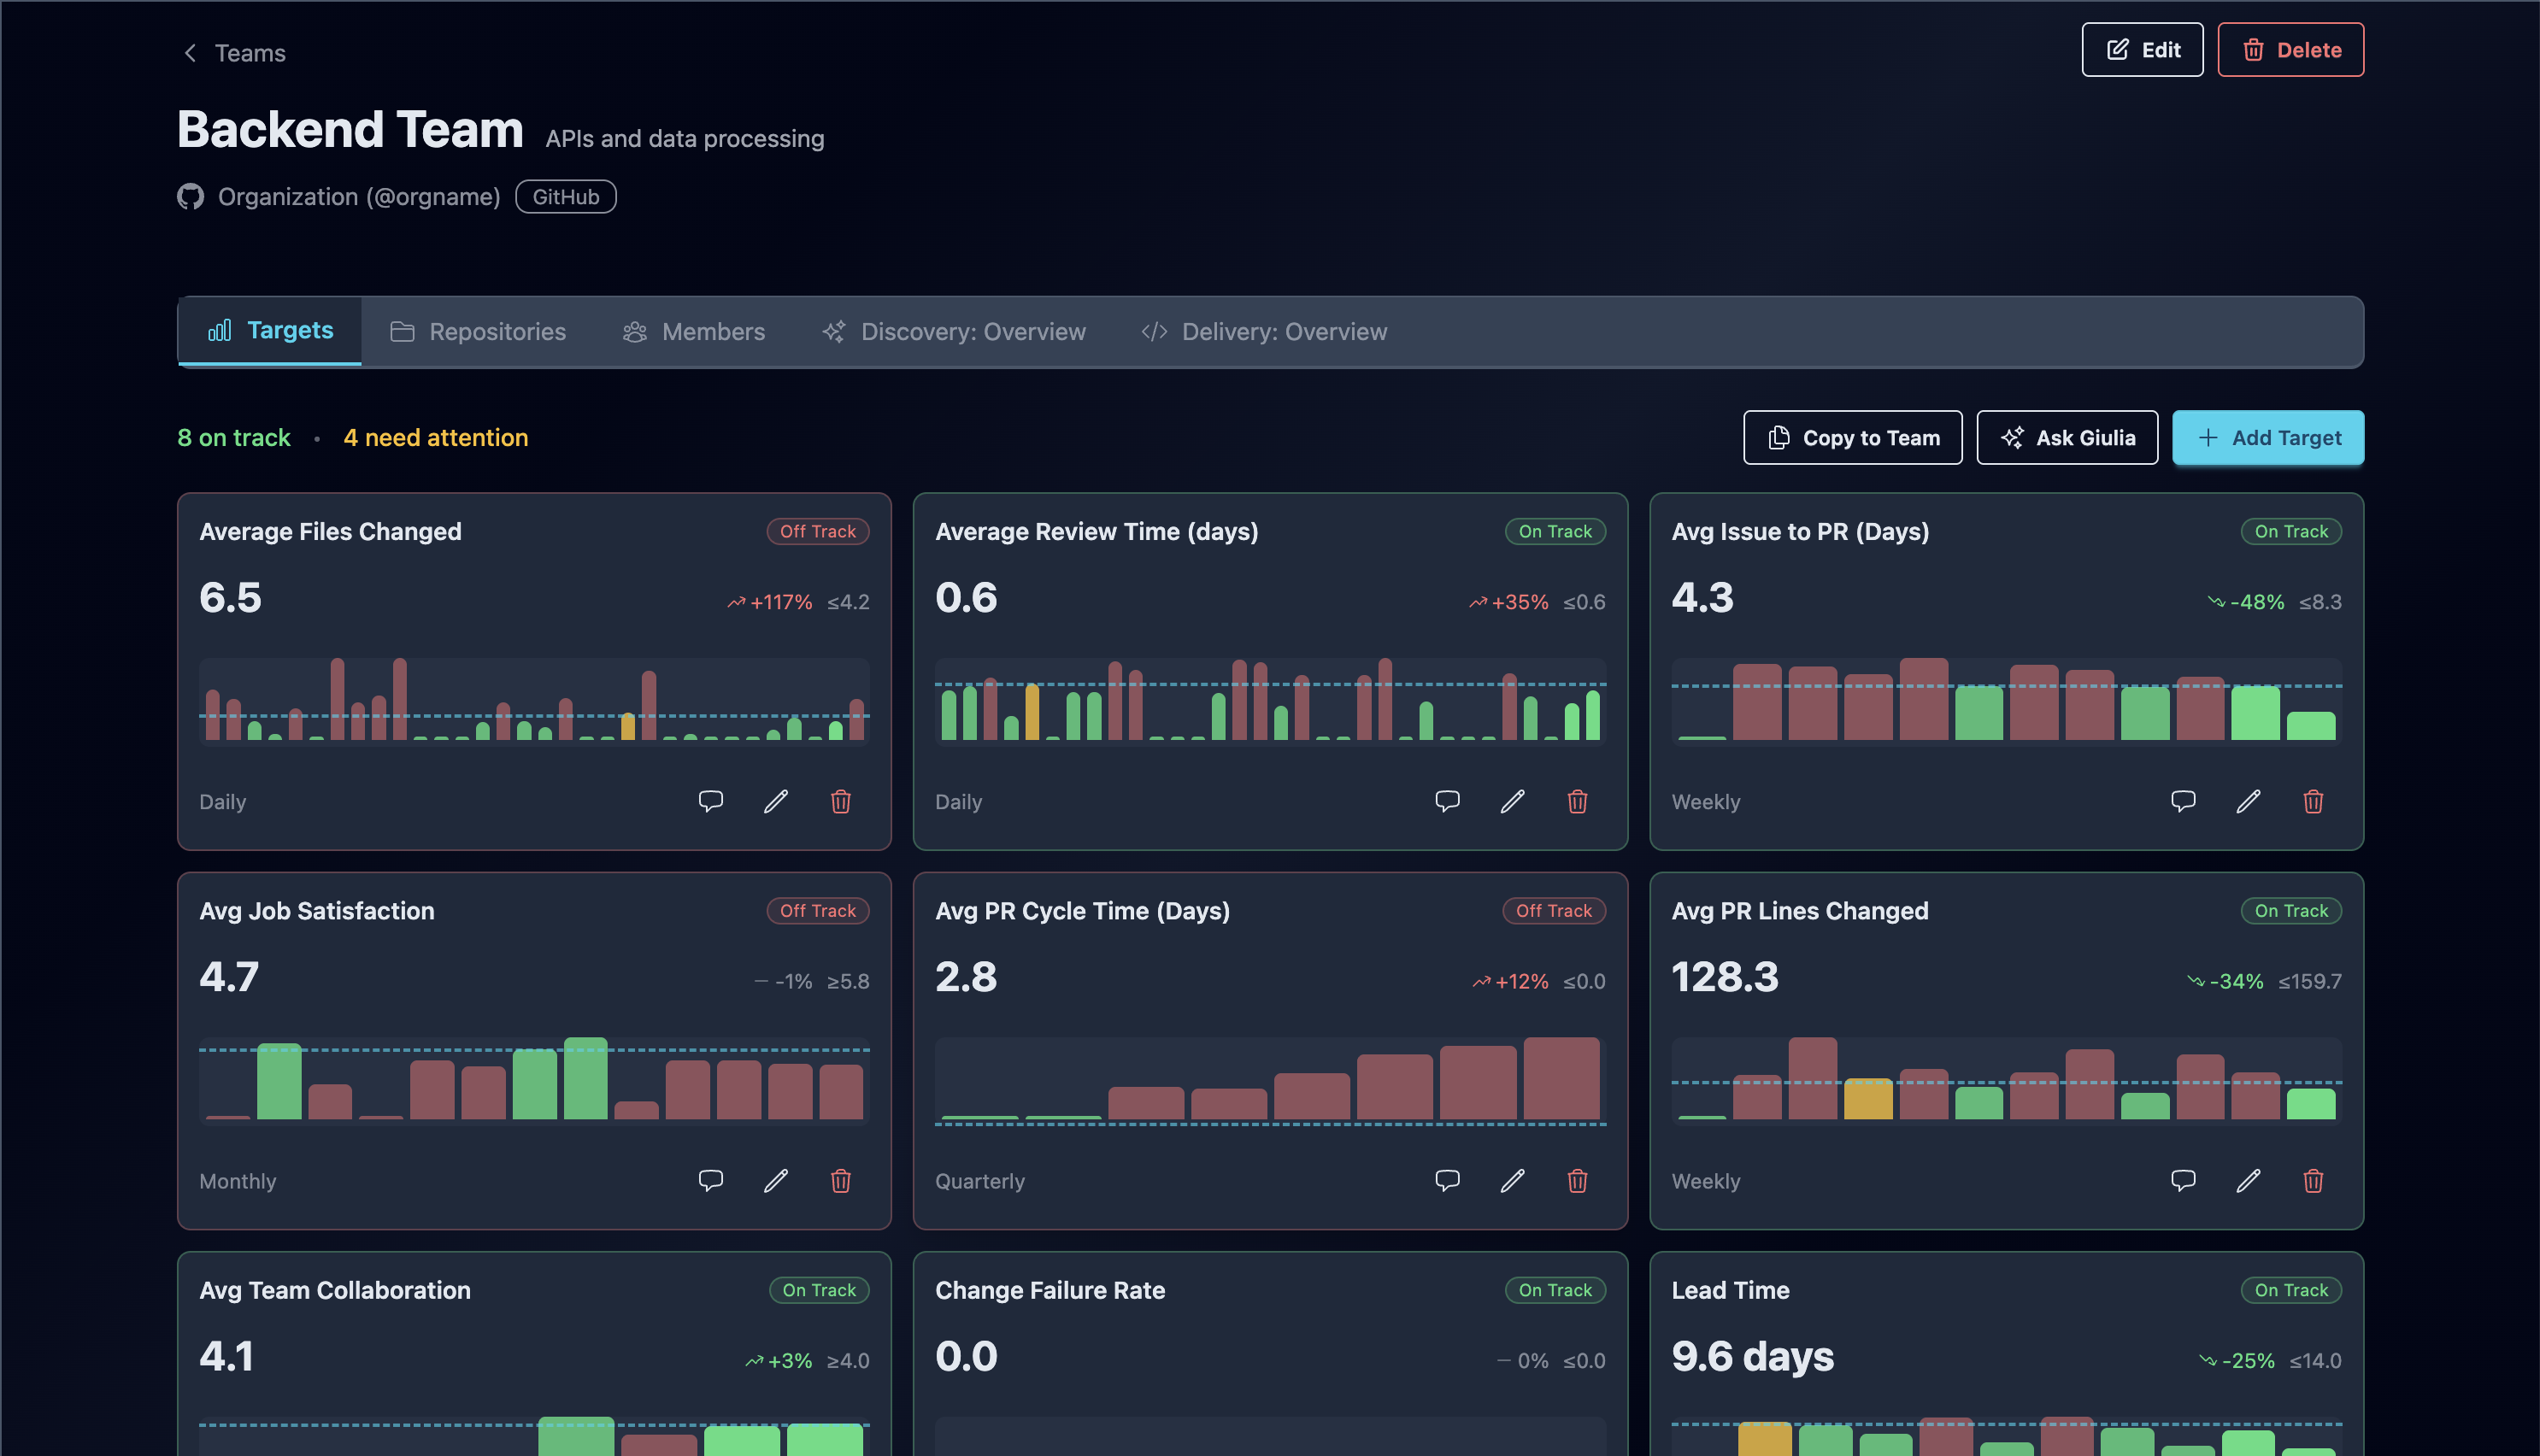
Section titled “Finding Guide Rails in the UI”Guide rails appear on the Team Detail page. Navigate to any team to see:
- KPI Dashboard - A grid of KPI cards showing all active guide rails for the team
- Add Guide Rail Button - Opens the guide rail creation wizard or AI assistant
- Guide Rail Actions - Edit, comment on, or archive individual guide rails
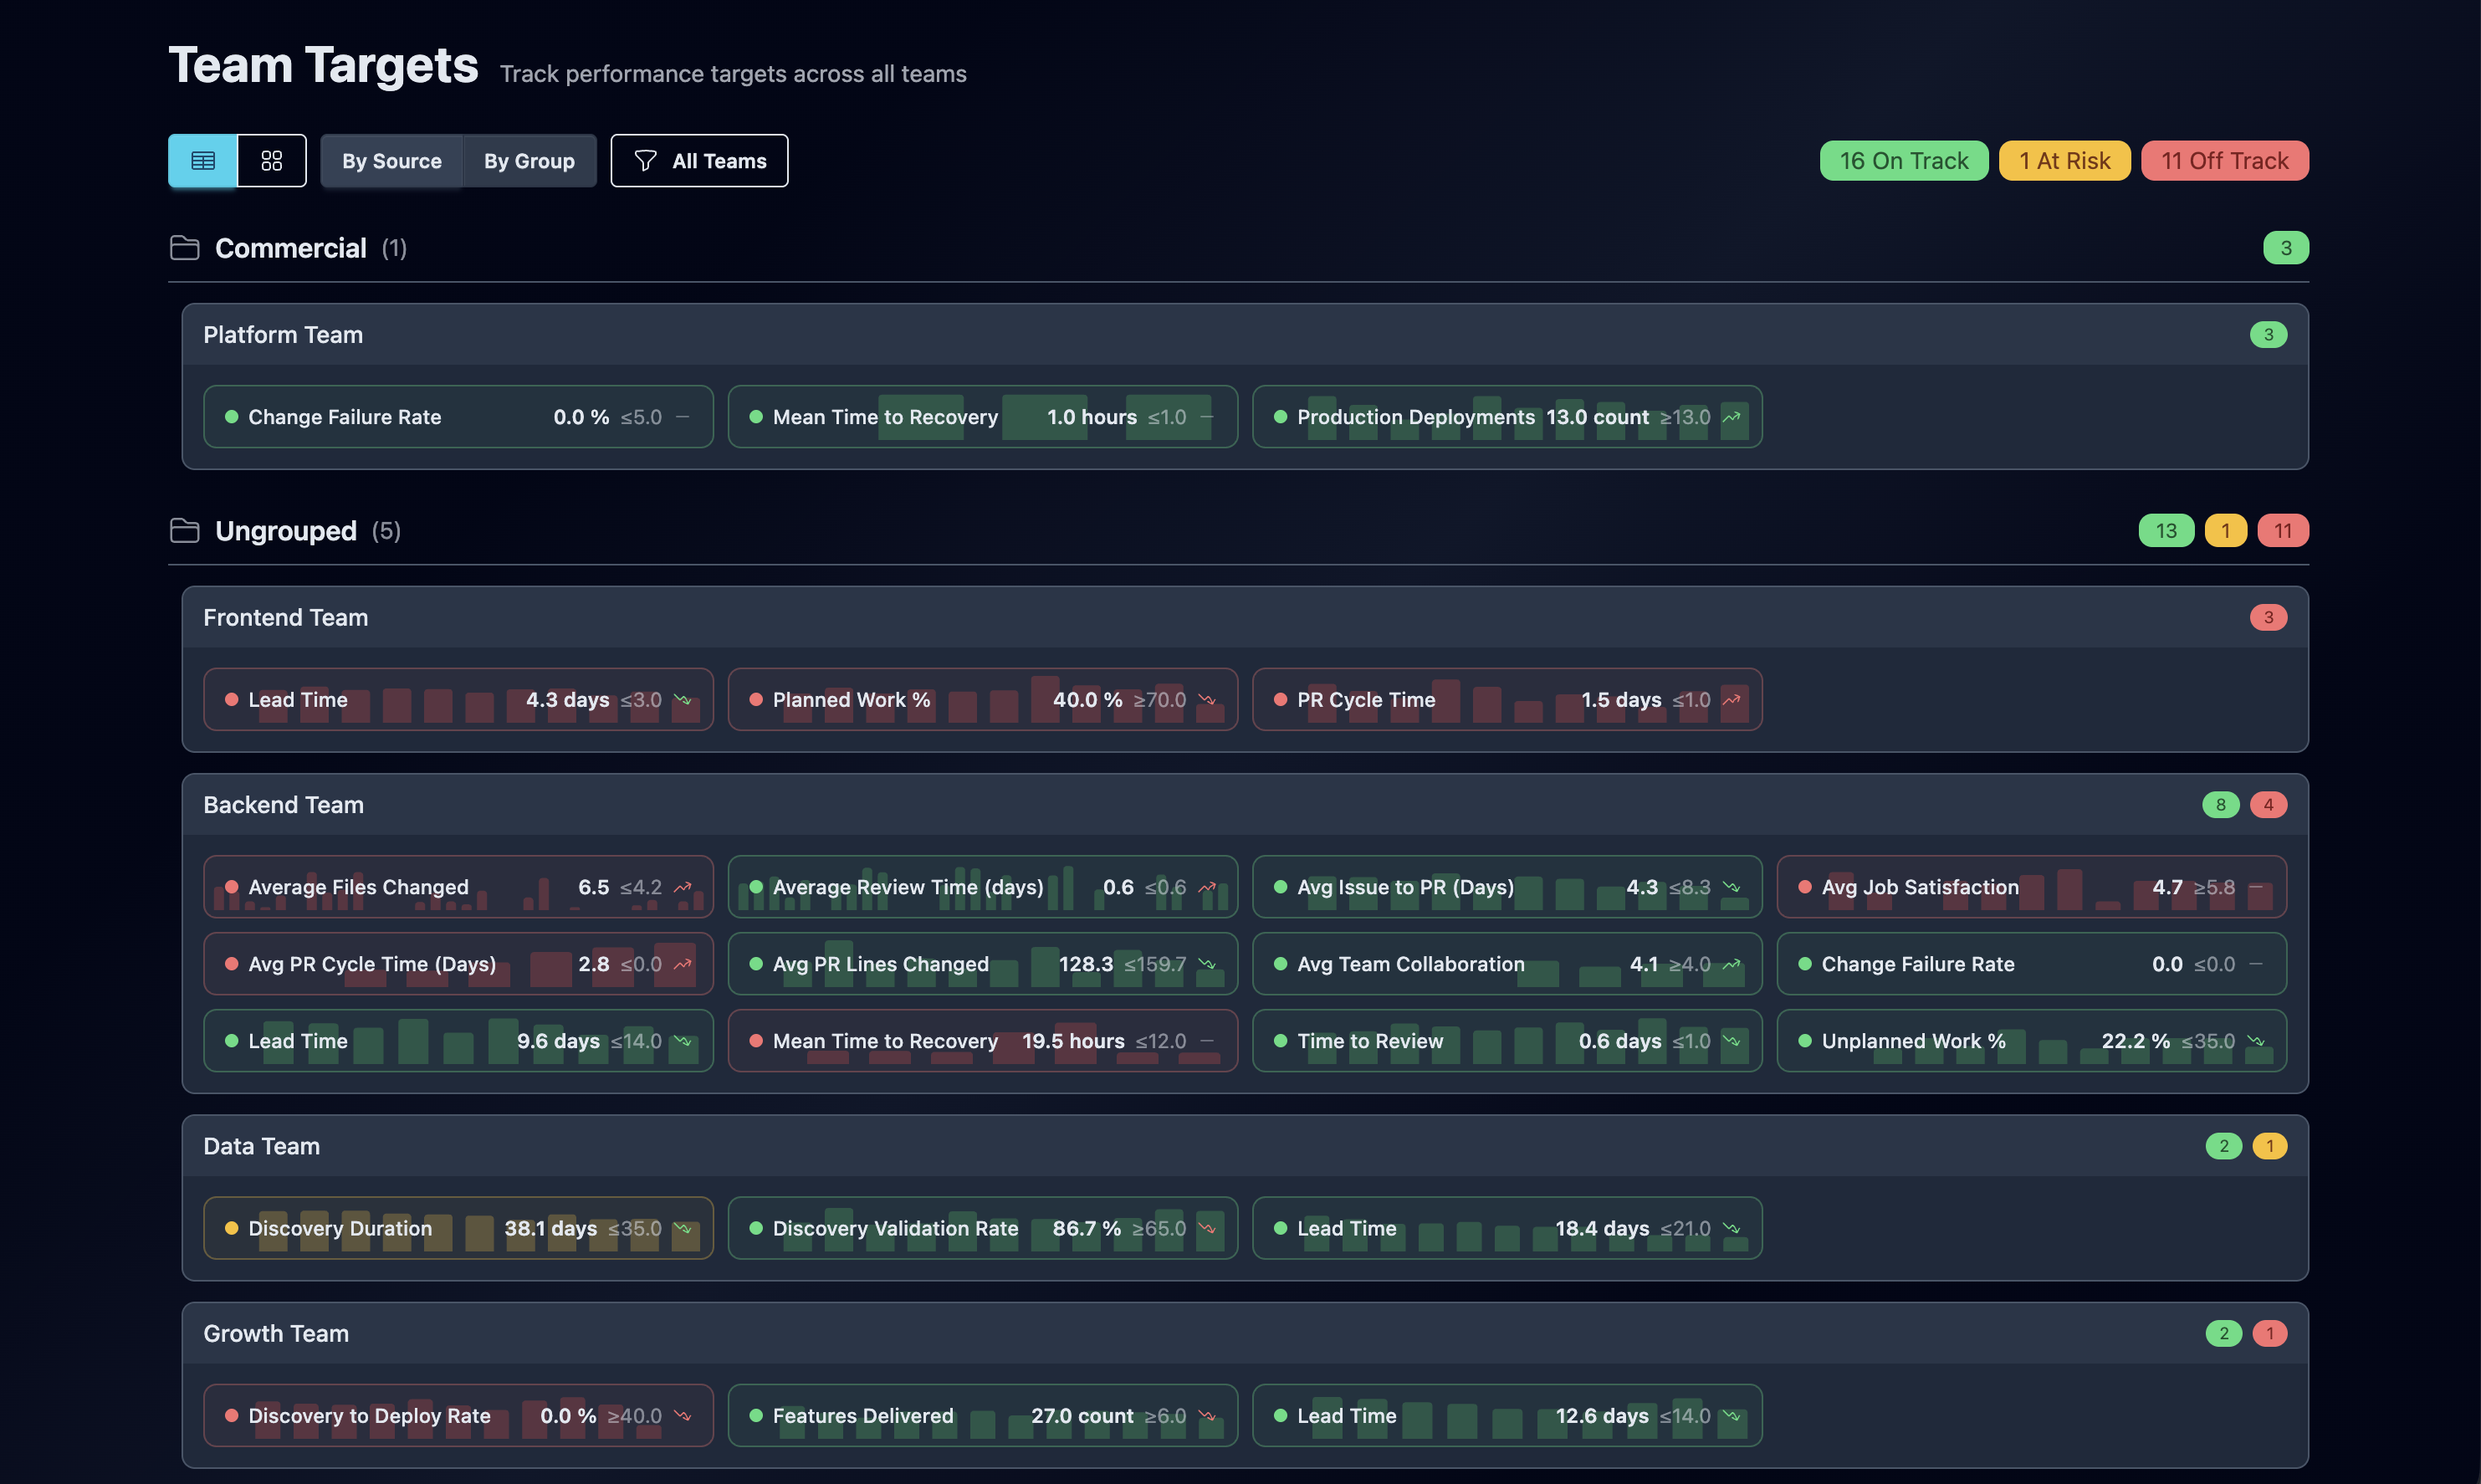
You can also view guide rails across all teams from the Team Guides dashboard, which groups guide rails by team and shows overall status counts.
Understanding KPI Cards
Section titled “Understanding KPI Cards”Each guide rail is displayed as a KPI card with the following elements:
Status Indicators
Section titled “Status Indicators”| Status | Color | Meaning |
|---|---|---|
| On Track | Green | Current value meets or exceeds the guide rail |
| At Risk | Yellow | Current value is within 10% of the guide rail threshold |
| Off Track | Red | Current value is not meeting the guide rail |
Card Elements
Section titled “Card Elements”- Metric Name - The measure being tracked (e.g., “Average Cycle Time”)
- Status Badge - Visual indicator of current status
- Current Value - The latest measured value in the appropriate format
- Trend Arrow - Shows direction of change (improving, stable, declining)
- Guide Rail Line - Displays the guide rail value for comparison
- Historical Chart - Bar chart showing performance over the selected granularity
- Granularity Label - Shows whether tracking is daily, weekly, monthly, or quarterly
Reading the Chart
Section titled “Reading the Chart”The bar chart on each KPI card shows historical performance:
- Each bar represents one period (day, week, month, or quarter)
- Bar colors indicate status for that period (green/yellow/red)
- A dashed line shows the guide rail value
- Hover over bars to see exact values and dates
Guide Rail Status Calculation
Section titled “Guide Rail Status Calculation”GuideMode automatically calculates status based on the guide rail type:
For Minimum guide rails (higher is better):
- On Track: Current value >= guide rail value
- At Risk: Current value >= 90% of guide rail value
- Off Track: Current value < 90% of guide rail value
For Maximum guide rails (lower is better):
- On Track: Current value <= guide rail value
- At Risk: Current value <= 110% of guide rail value
- Off Track: Current value > 110% of guide rail value
For Exact and Range guide rails:
- Status is calculated based on proximity to the guide rail value or range bounds
Next Steps
Section titled “Next Steps”- Creating Guide Rails - Learn how to create guide rails manually or with AI assistance
- Delivery Flow - Explore available delivery metrics
- DORA Metrics - Set guide rails for industry-standard metrics