
How It Works
GuideMode measures the complete software development lifecycle using the DX² framework: Discovery × Delivery. This guide explains how the system works, from categorizing your issues to calculating metrics.
The DX² Philosophy
Section titled “The DX² Philosophy”Most developer experience platforms only measure delivery: deployments, lead time, and throughput. But shipping fast doesn’t matter if you’re building the wrong thing.
DX² = Discovery × Delivery
GuideMode tracks both dimensions:
- Discovery: Research, validation, and learning before building
- Delivery: Building, testing, and shipping to production
This gives you end-to-end visibility from initial hypothesis to production impact.
The Double Diamond Model
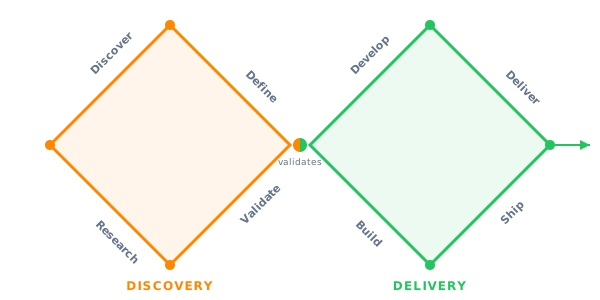
Section titled “The Double Diamond Model”GuideMode’s methodology is based on the Double Diamond design process, originally developed by the British Design Council.
Discovery Diamond
Section titled “Discovery Diamond”The first diamond represents the discovery phase:
- Discover (diverge): Explore the problem space, conduct research, interview users
- Define (converge): Validate hypotheses, narrow down to a specific problem to solve
Issues in this phase are typed as discovery (spikes, research, investigations).
Delivery Diamond
Section titled “Delivery Diamond”The second diamond represents the delivery phase:
- Develop (diverge): Explore solutions, write code, create PRs
- Deliver (converge): Test, review, deploy to production
Issues in this phase are typed as feature, bug, chore, or incident.
The Connection Point
Section titled “The Connection Point”The center vertex is where validated discoveries become features. This connection is tracked via the validates link type, enabling end-to-end visibility from research hypothesis to production deployment.
Issue Types
Section titled “Issue Types”GuideMode uses six canonical issue types to categorize work. See Issues for complete details on types, states, and lifecycle.
| Type | Phase | Flow |
|---|---|---|
discovery |
Discovery | Research → Validate → Feature |
feature |
Delivery | Build → Deploy |
bug |
Delivery | Fix → Deploy |
chore |
Delivery | Build → Deploy |
incident |
Delivery | Emergency Fix → Deploy |
other |
Either | Varies |
For detailed metrics on each type, see:
- Discovery Flow - Discovery issue metrics
- Delivery Flow - Feature, bug, chore, incident metrics
Label Mapping
Section titled “Label Mapping”GuideMode automatically maps your issue tracking labels to canonical types using a three-tier priority system. See Issues → Type Mapping for the complete reference including default patterns and provider-specific behavior.

To configure custom label mappings, go to Settings → Work Tracking → Label Mappings.
Issue Links
Section titled “Issue Links”Issue links connect work items across the discovery and delivery phases. See Issue Linking for complete documentation on link types and detection methods.
The Validates Link
Section titled “The Validates Link”The validates link is the key connection between discovery and delivery, enabling DX² metrics:

This link enables:
- Validation rate: What percentage of discoveries led to features?
- End-to-end lead time: Time from discovery creation to production deployment
- Research ROI: Connect research investment to delivered value
End-to-End Flow
Section titled “End-to-End Flow”Here’s how work flows through GuideMode from discovery to production:

For detailed entity documentation, see:
- Issues - Issue types, states, and lifecycle
- Pull Requests - PR workflow and metrics
- Deployments - Deployment tracking and DORA metrics
Invalidated Discoveries
Section titled “Invalidated Discoveries”Not all discoveries lead to features - and that’s valuable! Invalidated discoveries represent hypotheses that were disproven during research. This is learning, not failure.
GuideMode tracks:
- Validation rate: % of discoveries that became features (target: 50-70%)
- Invalidation count: Discoveries closed without features
- Discovery duration: Time spent on research (validated vs invalidated)
Metrics Mapping
Section titled “Metrics Mapping”GuideMode calculates metrics at each stage of the flow. Here’s how metrics map to the end-to-end process:
Discovery Metrics
Section titled “Discovery Metrics”| Metric | Calculation | Flow Point |
|---|---|---|
| Discovery Duration | Issue created → Issue closed | Length of discovery phase |
| Validation Rate | Validated / Total completed | Discovery → Delivery conversion |
| Discovery to PR | Issue closed → First PR created | Handoff to delivery |
| Discovery to Production | Issue closed → First deploy | End-to-end from validation |
See Discovery Flow for complete reference.
Delivery Metrics
Section titled “Delivery Metrics”| Metric | Calculation | Flow Point |
|---|---|---|
| Issue to PR | Issue created → First PR | Time to start work |
| PR to Review | PR created → First review | Review wait time |
| PR to Merge | PR created → Merged | Review cycle time |
| Issue to Deploy | Issue created → First deploy | Total delivery time |
See Delivery Flow for complete reference.
DORA Metrics
Section titled “DORA Metrics”| DORA Metric | Calculation | Flow Point |
|---|---|---|
| Deployment Frequency | Count of production deploys | Deployment count |
| Lead Time for Changes | PR merged → Deployed | Merge to deploy |
| Change Failure Rate | Failed / Total production deploys | Deployment failures |
| Mean Time to Recovery | First failure → First success | Recovery from failures |
See DORA Metrics for complete reference with benchmarks.
Practical Examples
Section titled “Practical Examples”Example 1: Validated Discovery Flow
Section titled “Example 1: Validated Discovery Flow”A typical discovery-to-production journey:
Day 1:  Create issue "Spike: Investigate caching strategies"        Labels: [spike, performance]        → GuideMode type: discovery
Day 5:  Close discovery with findings        Duration: 5 days
Day 5:  Create "Add Redis caching layer"        Labels: [enhancement]        Link: "validates" → discovery        → GuideMode type: feature
Day 6:  Create PR #123        Issue to PR: 1 day
Day 8:  PR merged after review        PR to Merge: 2 days
Day 8:  Deploy to production (15 min after merge)        Merge to Deploy: 15 minutes
Metrics:├── Discovery Duration: 5 days├── Discovery to Production: 3 days (from close)├── Total Lead Time: 8 days (discovery to production)└── Lead Time for Changes: 15 minutes (PR merged to deploy)
Example 2: Bug Fix Flow (No Discovery)
Section titled “Example 2: Bug Fix Flow (No Discovery)”A direct bug fix without discovery:
Day 1:  Create issue "Fix: Login button not responding"        Labels: [bug]        → GuideMode type: bug
Day 1:  Create PR #456 with fix        Issue to PR: 4 hours
Day 2:  PR merged after review        PR to Merge: 20 hours
Day 2:  Deploy to production        Merge to Deploy: 30 minutes
Metrics:├── Issue to Deploy: 1.5 days├── PR to Merge: 20 hours└── Lead Time for Changes: 30 minutes
Example 3: Invalidated Discovery
Section titled “Example 3: Invalidated Discovery”Research that proves an idea wrong:
Day 1:  Create "Spike: Evaluate GraphQL migration"        Labels: [spike, architecture]        → GuideMode type: discovery
Day 10: Close discovery - migration not viable        Decision: REST API sufficient for needs        No feature created
Metrics:├── Discovery Duration: 10 days├── Validation Status: invalidated└── No downstream delivery metrics (expected)
This invalidated discovery is valuable - it prevented investing in an unsuitable architecture.
Related Documentation
Section titled “Related Documentation”Core Concepts
Section titled “Core Concepts”- Issues - Issue types, states, and lifecycle
- Pull Requests - PR workflow and code metrics
- Deployments - Deployment tracking and environments
- Issue Linking - Connecting discoveries to delivery
Analytics
Section titled “Analytics”- Analytics Overview - Introduction to analytics
- Discovery Flow - Detailed discovery metrics
- Delivery Flow - Detailed delivery metrics
- Deployment Flow - Deployment pipeline metrics
- DORA Metrics - DevOps performance metrics
- SPACE Framework - Developer productivity framework
- Integrations Overview - Connect your tools